
The Department of Corrections (DOC) uses data analytics and business intelligence methods to assist the department with making informed decisions by examining collected data and identifying new opportunities to further the agency's mission, “To improve public safety by positively changing lives.”
Agency Data Dashboards
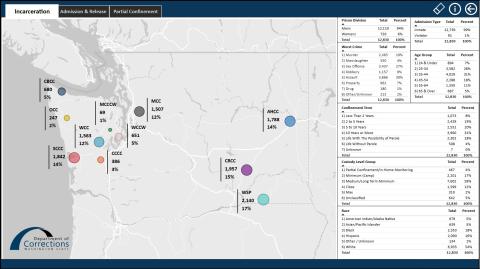
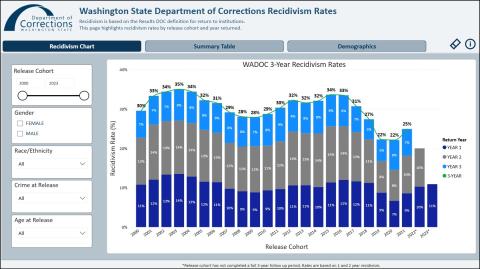
These dashboards are powered by Microsoft Power BI and are not optimized for mobile devices or minimized windows at this time. For help navigating, see tutorial video.
Statistical Reports
All Department of Corrections reports, including the statistical reports listed below, can be found in the Publications archive.
- Agency Fact Card 100-RE004
- Agency Fact Card – Expanded 100-RE005
- Average Daily Population of Incarcerated Individuals in Prisons 400-RE002
- Cost per Incarcerated Individual per Day 200-RE019
- Cost per Incarcerated Individual per Prison 200-RE020
- Incarcerated Population and Supervision Caseload Compared to Forecasts 400-RE001
- Prison Admissions and Releases by County (Excel) 200-RE001
Data Sets & Statistics Directory
Below is a list of data sets & statistics embedded throughout the website.
- Blake Decision Refunds
- Capital Punishment – Executions by Ethnicity
- Department of Natural Resources Work Crews
- Electronic Message Delivery Distribution
- Extended Family Visits
- Incarcerated Individuals Betterment Fund Fiscal Year Approved Expenditures
- Incarcerated Individuals Deaths
- Parent/Teacher Conferences Completed Each School Year
- Prison Population by Age
- Tribal Relations Statistics
- Volunteer Statistics – Hours Donated